Remote Sensing
Navigation devices, smartphones and weather forecasts are dependent on satellites and without these we have to rely on some services that make our everyday life easier.
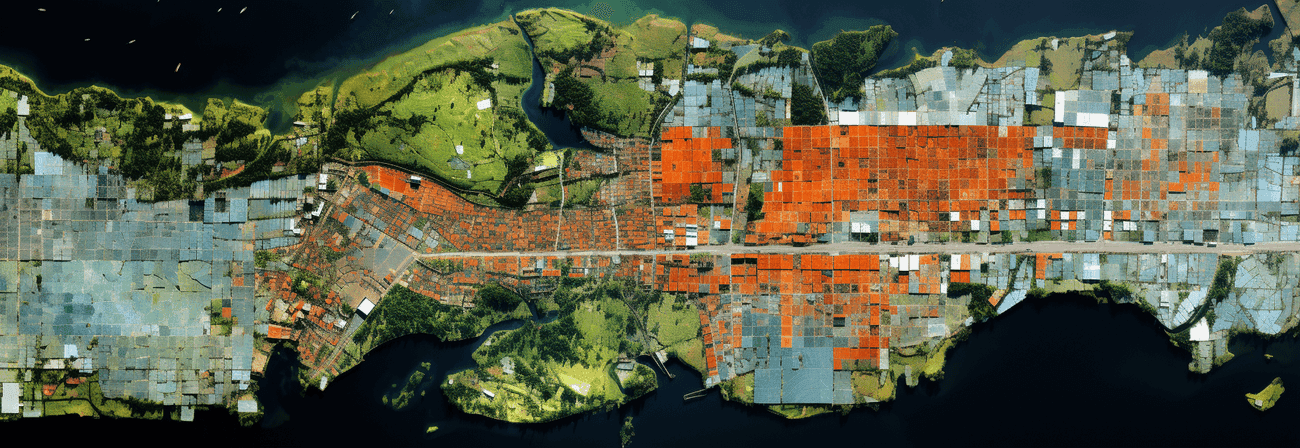
Images of the Earth from satellites or aircraft are constantly being recorded. These remote sensing data often have a resolution of up to 30cm, are recorded in a range from 450nm to 2273nm and are mostly referenced by the operators of the satellites.
These pictures are then sold or even provided by many providers free of charge.
Copernicus Open Access Hub
On Sentinel Open Access Hub you can find free products from the Copernicus Program, those from the European Union and others operated by the European Space Agency (ESA).
The Copernicus program basically comprises six satellites (Sentinel-1, Sentinel-2, Sentinel-3, Sentinel-4 (planned start in 2021), Sentinel-5 and Sentinel-6 (planned start in late 2020) .
All of these satellites perform different tasks and help to observe land, sea and the atmosphere.
In the Copernicus Open Access Hub, you can now download all the data provided after registering free of charge. All available data is displayed for download via search criteria and a desired image section, which you can simply draw with a rectangle
ArcGIS currently supports level 1C products.
These image files are relatively large and it may take a while (depending on the internet bandwidth) before the ZIP file is downloaded.
Image classification
These multispectral bands can then be integrated in Arc-GIS or QGIS.
A classification now consists of two main components.
- Generate Training Samples and
- Classification based on the training samples and validation
Generate_Training samples
First, a classification method must be selected (e.g. supervised and pixel-based). This classification method divides individual pixels of the satellite image into thematic classes, e.g.
- Settlement
- Forest
- Water
- Meadow etc.
Here the system is taught (Machine Learning) that, for example, a green pixel stands for the forest class, blue for water, light green for meadow and gray for settlement ,
In order to get the most realistic result possible, one should choose areas / pixels that are as clear as possible for these samples. That For example, there shouldn't be a gray pixel in the class.
When the assignment of samples for each class is done, the actual classification now begins.
Classification based on training Samples and validation
There are various classification methods that can be used e.g. Maximum likelihood. The classification method now only has to be selected and the classification can then be started.
In order to check the quality of the classification, the results are usually validated with e.g. the ground truthing. method.
Then it is checked how many points were classified in the correct class (for example, a settlement was recognized as a settlement). Here one should not be too stingy with the Validierungssamples to achieve a meaningful validation of the image classification.
This can be noted in an Excel list and the overall accuracy of the classification can be easily calculated. Of course you have to write down the wrong and correct classification.
And that's it.
In short, remote sensing is the extraction of geodata or satellite images by satellites and the subsequent methodology (image classification) for evaluating this remote sensing data about the nature of the earth's surfac
