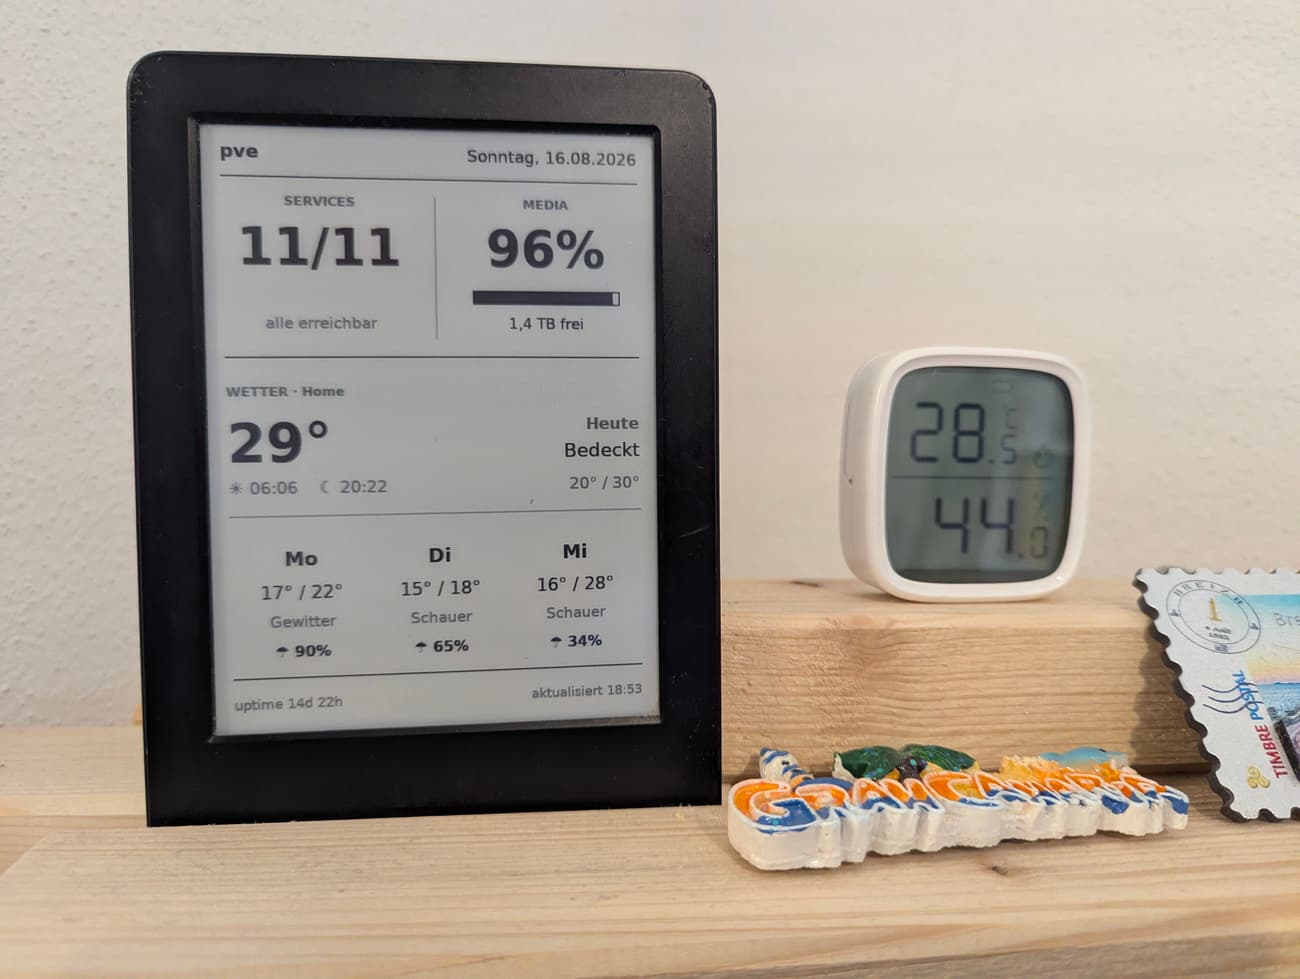
I had an old Kindle sitting in a drawer for years. It still charges, the battery seems to work, and the screen is perfectly readable in daylight.
Throwing it away felt wrong and at the same time I kept opening Proxmox or Uptime Kuma in a browser tab just to check whether anything in my homelab was broken. That is a lot of clicks for a question with a one-word answer. So the Kindle now stands on a shelf and shows the answer without me asking.
How it works
The split between device and server is deliberate. A Flask app runs in a container on one of my LXCs. It collects data from a few sources, renders a 600x800 grayscale PNG with Pillow, and serves it at /dash.png. The Kindle runs a shell loop that downloads that image every five minutes and draws it with eips.
The Kindle has no credentials and no configuration apart from the URL it fetches. It downloads an image and draws it. Everything else happens on the server.
Why I send a PNG instead of a web page
The other option would be a web dashboard with the Kindle's browser in kiosk mode. I did not try it, so I cannot tell you whether that works well or not.
Rendering on the server mostly means there is less on the device that can go wrong. The Kindle does one HTTP GET and one framebuffer write per refresh and runs nothing in between. It also means the panel is not tied to the Kindle, since anything that can display a PNG can be the screen.
One thing worth knowing either way: I serve the image over plain HTTP on the LAN, which is fine for something that never leaves the network. The TLS stack on a 2014 device will not validate a current certificate chain, so putting it behind the same reverse proxy as everything else was not an option. If you get the browser version working, I would like to hear how it went.
Deciding what not to show
Working out what to leave off took me longer than writing the rendering code.
My first version had CPU and RAM gauges at the top, because that is what dashboards have. After a few days I noticed I was ignoring both. On a Proxmox host RAM is allocation rather than usage, so it sits at 74% permanently, and CPU is a five-minute sample of a machine that does its actual work at 03:30, so it reads 3% permanently. Neither number changed and neither one ever made me do anything.
So both are gone. The top row now shows service monitors from Uptime Kuma and how full the media pool is, which are the two things I would actually stop for.
The weather fills the lower two thirds. It has nothing to do with the homelab, but I like having the forecast there and end up looking at it more often than at the rest of the panel.
Disk health has no tile either. SMART has said "fine" for years, and I would have stopped reading that tile within a week. The footer shows uptime instead, and only swaps in the failing device when a disk reports errors:
SMART: /dev/sdd 2 Fehler
Rain probability works the same way and only shows up above 20%. A row of 0% under three clear days only teaches you to ignore that line.
What I settled on for my own panel is that a value which has read the same for months does not get a tile. The panel has no front light, so the numbers themselves are always black for contrast. The line underneath each number stays gray while things are fine and turns black when they are not. The storage tile only spells out the free space once the pool is over 90 percent full, and the monitor tile names the service that is down rather than just reporting that everything is up.
It also shows photos
I do not need to know whether something is down at two in the morning, so between 22:00 and 07:00 the same URL serves a random photo from an Immich album instead. During the day it alternates between the dashboard and a photo every five minutes, which is also how often the Kindle fetches, so in practice the screen swaps over on each refresh. Nothing changes on the Kindle side, it keeps asking for the same URL.
The screen can only show sixteen shades of gray, and the dashboard is drawn with four of them: black, two grays and white. Nothing has to be converted afterwards, so the text and the lines stay crisp.
A photo has far more shades than that, so it has to be reduced first. Giving each pixel the nearest shade that is available turns a smooth sky into a few visible stripes. Dithering avoids that by mixing the shades it does have into a fine speckled pattern, which your eye blends back together from a normal viewing distance. That looks right on a photo, and doing the same to the dashboard would only make the text look dirty.
Reading SMART without waking the disks
My data disks spin down after ten minutes of inactivity via hd-idle and I did not want the dashboard to undo that. Polling smartctl every fifteen minutes would wake all the drives every fifteen minutes.
The Monday SnapRAID cron already runs snapraid smart and writes a log to /var/log/. The collector parses that log instead of talking to the disks and pulls out how many drives there are, how many report errors, and which one is worst. It is a file on the system SSD, so reading it costs nothing.
The pool usage comes from df, which does not touch the disks either. It reads the superblock the kernel already keeps in memory, so a spun-down disk stays spun down.
The Kindle side
Getting the Kindle jailbroken took longer than everything else combined. What worked for me on a KT2 (7th generation, 2014) running firmware 5.12.2.2 was WinterBreak, followed by the KindleModding Hotfix. This video walks through the whole sequence. Most of the guides I found first described older methods, and the published compatibility matrices disagree with each other for this device, so it is worth checking yours against the jailbreak wizard with your serial and firmware before you start.
The order of the steps matters, and two of them exist only to stop the Kindle updating itself out of reach while you work. This is the sequence that worked, with the exact file names and commands in docs/kindle.md, because I could not find it in one place anywhere:
- Stop the Kindle updating itself, by filling the disk. An update partway through undoes the work, and an update afterwards removes the jailbreak.
- WinterBreak for root. Copy it to the Kindle root, eject, turn airplane mode on and reboot. Then open the Kindle Store, turn airplane mode back off so wifi comes up, and tap the WinterBreak icon.
- The Hotfix. Copy
uptodate_hotfix_universal.binto the root, run Settings → Device Options → Update Your Kindle, then tap Run Hotfix in the library once. - MRPI, then KUAL, both from MobileRead thread 225030. Of the two KUAL builds there the
coplateone works and the plain one does not. - renameotabin, run from KUAL. This is what blocks OTA updates permanently, and an update is the one remaining way to lose the jailbreak.
- USBNetwork, for SSH. Take the file named
pw2_and_updespite the Paperwhite name, it is the right target for a KT2. SetUSE_WIFI=TRUE, and put your public key inusbnet/etc/authorized_keyson the mounted drive rather than in~/.ssh, since the rootfs is read only andssh-copy-idcannot work. The root password is not empty on this build, whatever the older writeups say. - The scripts, into
/mnt/us/documents/. Check they parse withsh -nfirst, because busybox reports a Windows line ending assyntax error: unexpected end of fileand points at the last line rather than the real cause.
That is the whole required path. Most guides also send you to install kterm and KPM, a terminal and a package manager and I did install both. Neither turned out to be necessary. USBNetwork is configured by editing a file on the mounted drive, with no shell involved at all.
Worth having anyway: disable_ads.sh from notmarek's scriptlets if your device carries Special Offers, since ads appear in the gaps before the loop starts and after restore.sh.
Once rooted, the KindleModding Hotfix provides sh_integration, which makes any .sh file in /mnt/us/documents/ show up in the library as a tappable entry. So the dashboard starts by tapping what the Kindle thinks is a book:
The loop on the Kindle is a few lines of sh. It downloads the image to a temporary file, moves it into place only if the download actually worked, and draws it with eips -g. Every twelfth cycle it runs eips -c first, which clears the e-ink ghosting. When a fetch fails the last good frame stays on screen and the failure goes to a log rather than onto the panel. The rendered image has an aktualisiert 23:03 timestamp on it, so if the time stops updating you can see that the connection is gone. That was enough, I did not add an error message on top of it.
Starting the loop stops lab126_gui, the reader UI, which also kills the touchscreen. The way back is a second script, restore.sh, run over SSH. Get SSH working before you run the dashboard for the first time rather than after. Once the loop is running, SSH or a twenty second power hold are the only ways back.
Running it yourself
The code is on https://github.com/dietrichmax/dashink. Every source is optional and gets left off the panel when it is not configured, so a latitude and a longitude is already enough to get something on the screen. Host stats work on any Linux machine without configuring anything. Reading them from the Proxmox API instead is optional, and gives CPU utilization and allocated memory rather than a load average and the memory actually in use, which is the reason those two figures never moved for me.
The panel is currently fixed at 600x800, which covers the basic Kindle models. Larger Paperwhite screens would need the layout to scale, which I am happy to add if someone wants to run it on one.
Nothing about the panel is tied to a homelab either. It could just as well show Home Assistant data or a reminder for which bin has to go out this week. All it has to end up as is an image.
It runs on a Kindle I already owned and costs nothing to keep running. This is only the way I ended up doing it though, and there are probably a hundred other ways to get an image onto an e-ink panel.